by Justin J. Long CFP® on Jan 5, 2026 6:23:22 AM
Where We Were
2025 was another great year for equities, as well as fixed income – despite a cloud of despair present in so many minds around the country. President Trump rode a strong wave of economic hope and goodwill early in the year, mostly focused on dismantling selective government overreach and lowering taxes. That goodwill was quickly dashed against the rocks of see-saw tariff and trade policy changes, retaliation by quite important (and powerful) trade partners, as well as an unwise attack on the Federal Reserve and the members of the FOMC. As a result, confidence as well as economic and earnings growth projections tapered off between the end of Q1 and into Q2. That both coincided with, and likely caused, an overdue equity market correction between March and April.
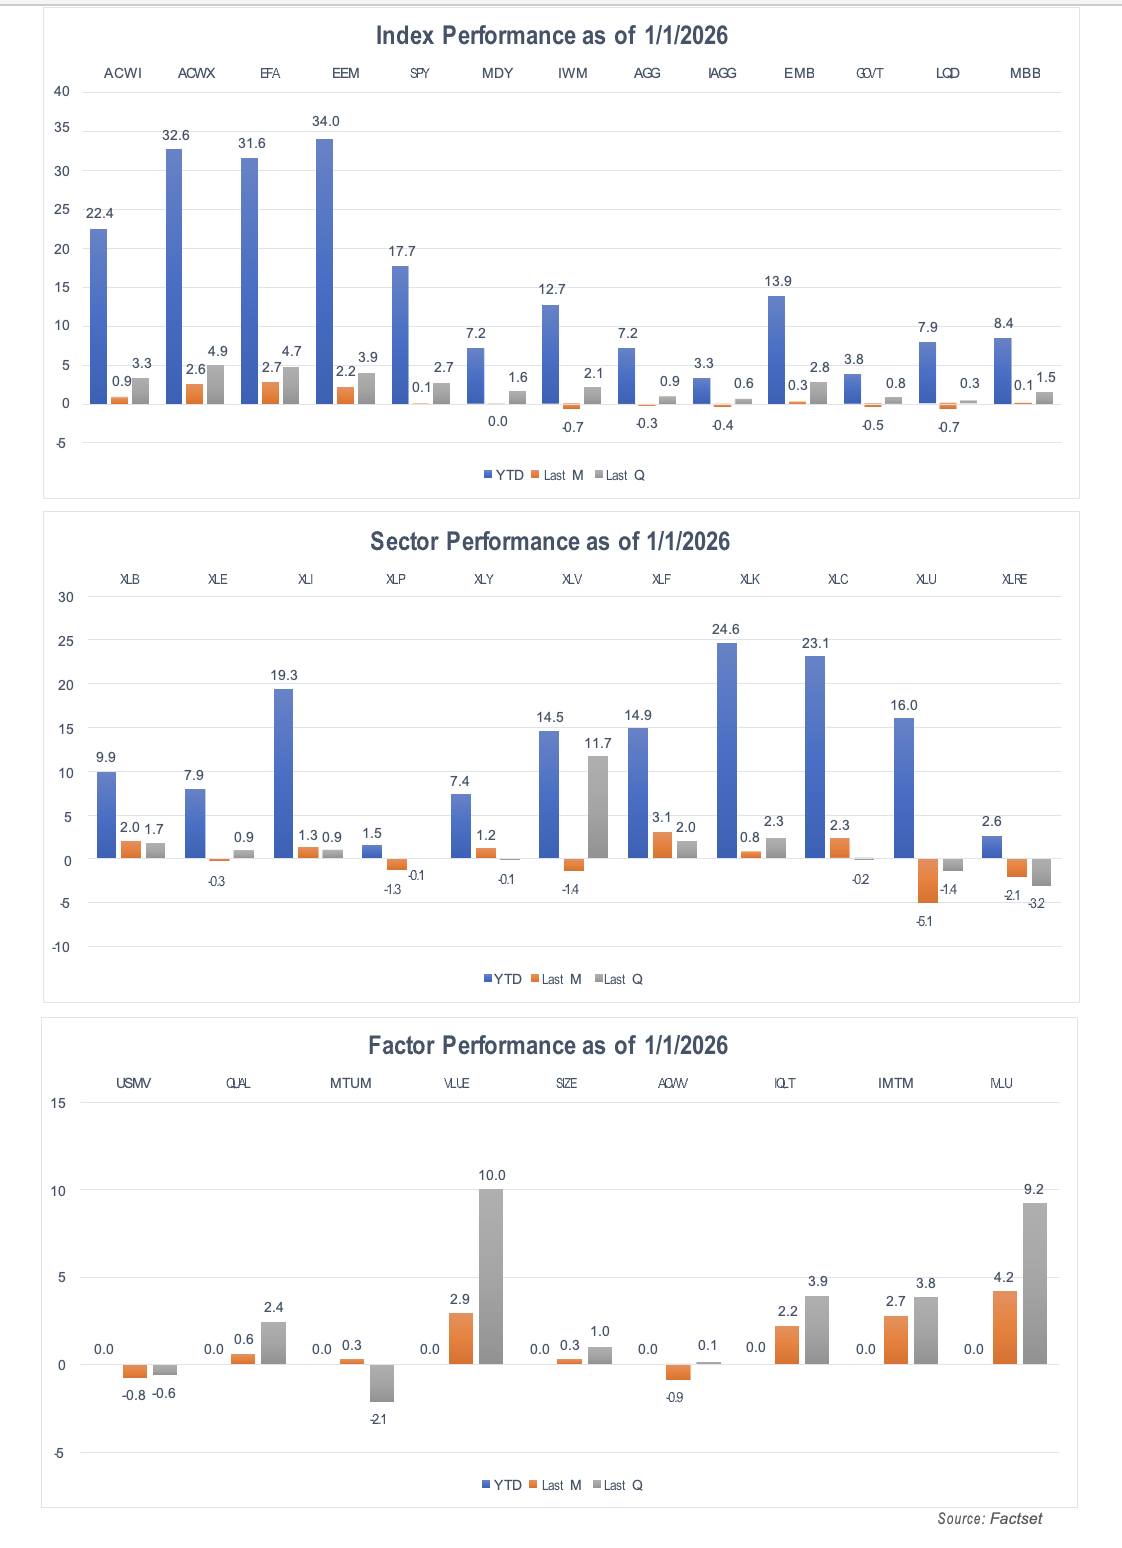
Market conditions and confidence rose again after Q2 earnings results started to come in, as they did not reflect the doom-and-gloom forecasts of many an economist and talking head. Corporate earnings rode a tailwind of stronger-than-expected incomes, spending and net worth, as well as expanding margins and cash flow led by growth companies. Strong earnings results and forecasts continued throughout the rest of the year. Equity returns were strong across the board and led by foreign emerging markets (+34%), foreign developed markets (+31%), and US large cap growth (again, +22%). The S&P 500 rose +18%. Fixed income returns were extremely even across the board and generally well above their long-term averages, buoyed by tapering inflation and overall US economic growth projections (after inflation) of a bit less than 2%. The Aggregate Bond index rose 7%, while 7-10 year Treasurys, investment-grade corporates, mortgage-backed, and high yield bonds all returned 8+% on the year, proving once again that the Chicken Littles (“60/40 is dead”) should remain unheeded.
Where We Are
Source: Factset
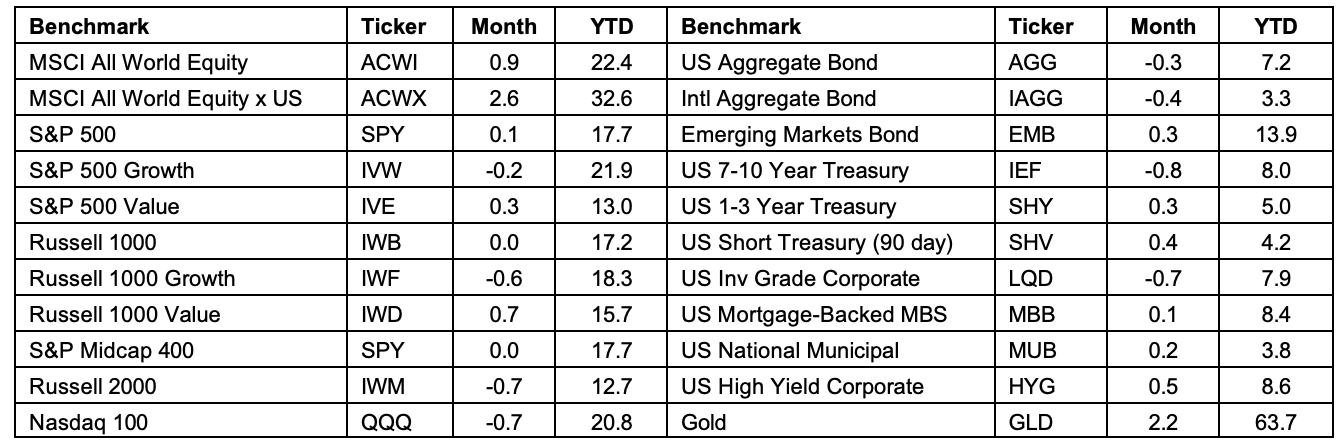

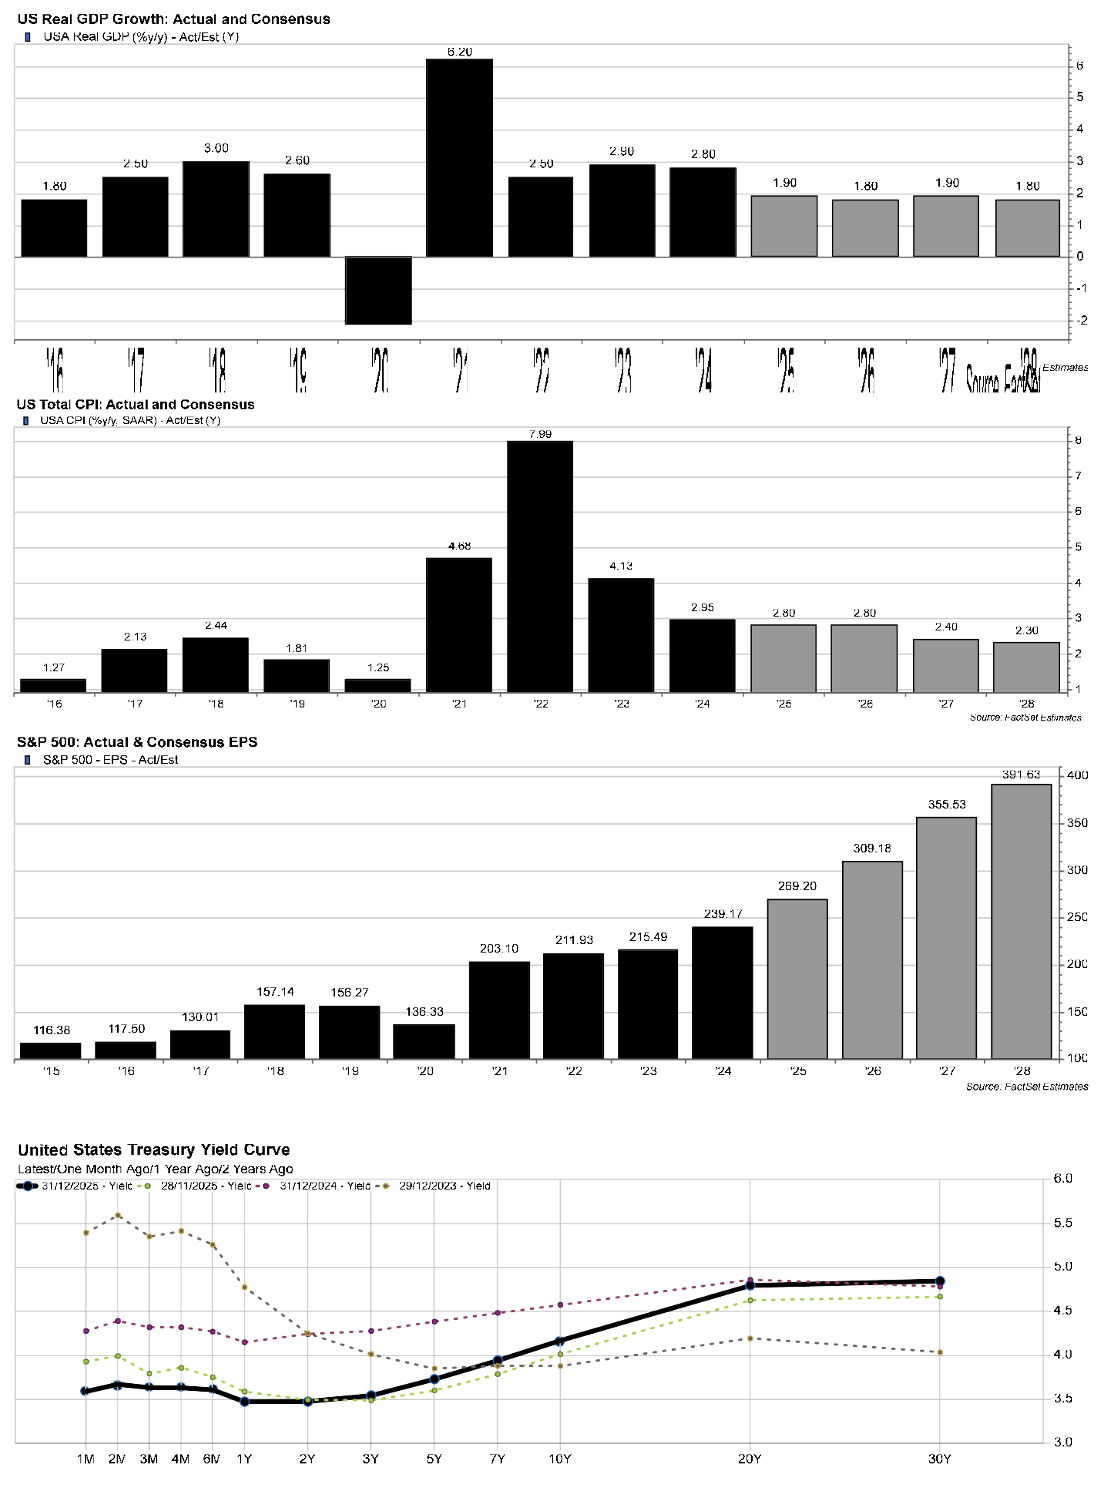
Less than 1% from its high. The S&P 500 index closed the month of December at 6845, in line with November and just a skosh from its all-time high. The index rose 18% for the year. [US Large Cap] Growth was up 22%, while Value gained 13%. The S&P 500 index was up 42% from the intraday low on April 7.
The Nasdaq 100 rebounded 53% from the same day's intraday low, and is within 3% of its high.
The US Aggregate Bond index was up 7.2% YTD (60/40 up 13.5%) in 2025. The 10-year T-Note yield is at 4.17%.
Q3 Results. With 100% of S&P 500 constituents reporting, 77% beat revenue estimates, with 9% y/y growth vs. the 5% forecast at the beginning of Q3. 83% of companies beat EPS estimates, with average growth of 14% vs. the 7% expected.
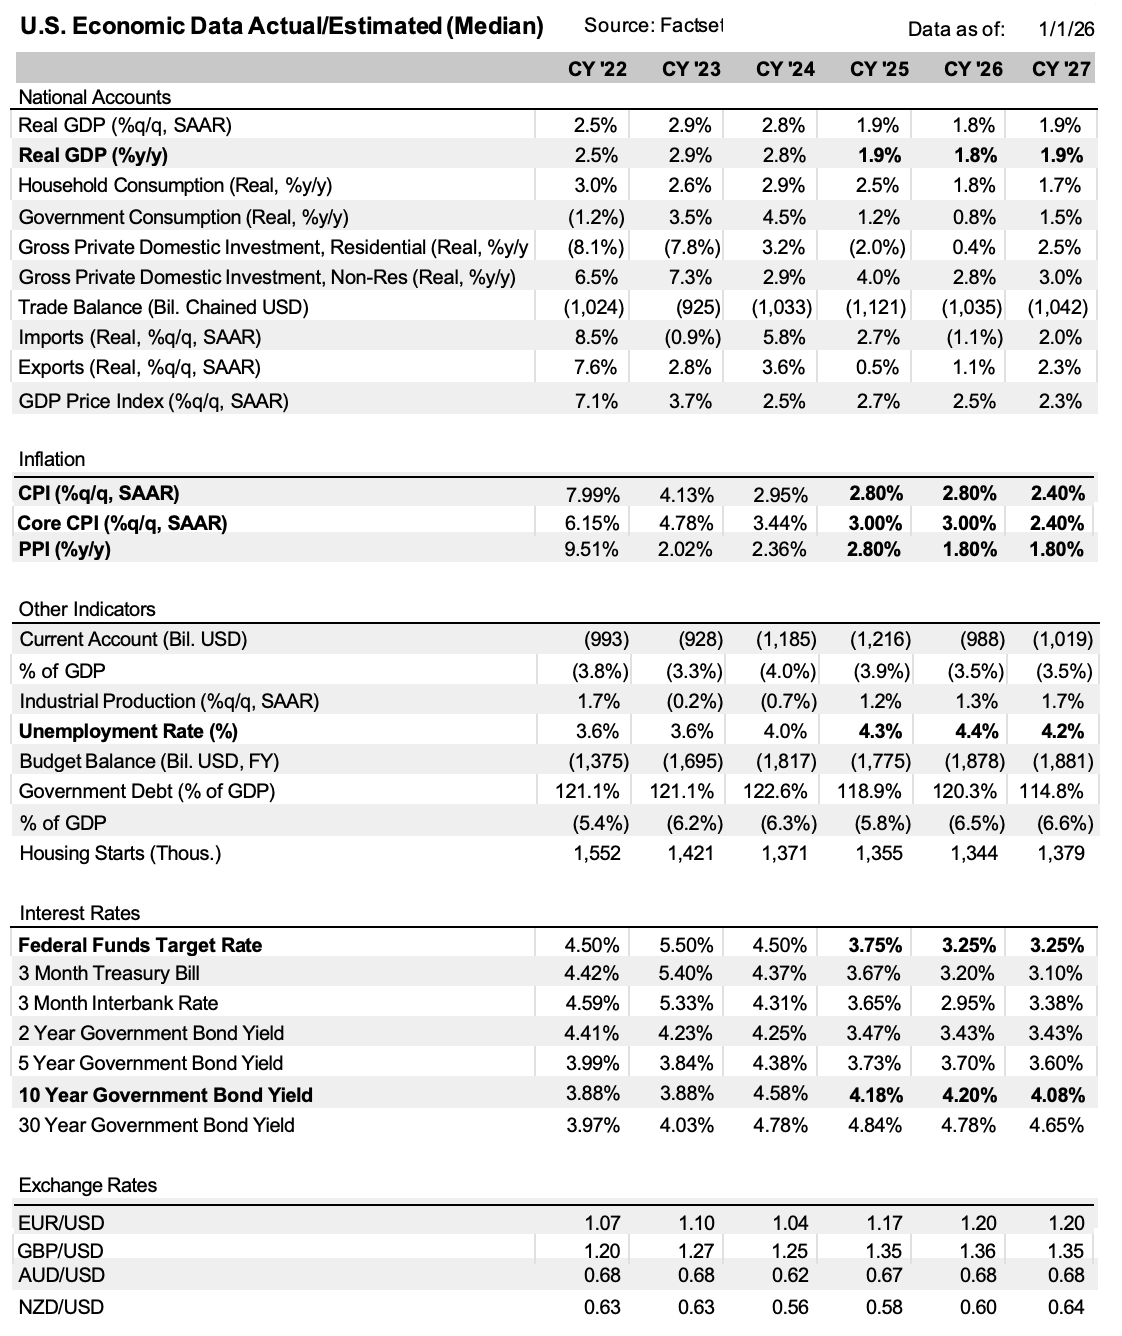
S&P 500 earnings expectations. For 2025, actual EPS is expected at $271/share, up 13% vs. 2024. The 2026 estimate is $311 (+15%), 2027 is $358, (+15%), and 2028 is $395 (+10). Each annual estimate is higher than it was six and twelve months ago. P/E ratios for ’26-28 are 22x, 19x and 17x. The P/E-to-Growth (PEG) ratios are 1.5, 1.4 and 1.7. The average EPS growth rate over the past 20 years is 7%; the average trailing and forward P/E ratios are 19x and 16x, while the 20-year average trailing PEG ratio is 2.7x. The consensus price target for the SPX is 8018, vs. 7966 a month ago and 7741 sixty days ago, for an implied return of +16%.
Where We're Headed
Goldilocks, growth disbelief, consolidation, change in leadership, index changes? Who among us believed we would see three strong years of equity and fixed income performance following the heinous 2022? Not we. Regardless that 2022’s correction was a healthy reaction to extraordinary gains from COVID lows (Newton’s 3rd Law), neither earnings expectations nor confidence foreshadowed such unusual total returns.
Certainly that was the case last year as well. Following 26% and 25% back-to-back years for the S&P 500 index, it was unlikely we would see an 18% gain in 2025. And close to double that for foreign markets. And for as much as we have the reputation of being “perma-bulls”, we saw (and passed on to you) the actual raw earnings and economic estimates which ended up supporting another strong performance year.
Those dynamics remain as we head into 2026. Overall GDP growth estimates for the next 3 years reflect over 5% nominal expansion and a bit less than 2% real growth (3% inflation), which means that the US is currently expected to grow slightly slower than the average seen over the past 30-years (6% nominal, 3% real). However, corporate sales and earnings estimates reflect a more robust outlook, especially for the S&P 500 index and the components which have driven sector weight changes. Take Information Technology for example, which comprised about 15% of the index value in 2005, and which makes up 34% of the index value today (this data is in the monthly Econ/Market slide deck, btw).
Sales growth estimates for the equal-weighted S&P 500 index, the market-cap weighted S&P 500 index (primary benchmark), and the S&P 500 Growth index average 5%, 7% and 12% over the next two years, according to Factset. Earnings growth estimates average 10%, 15% and 20%. In other words, for all of the talk about continued growth fears and valuations relative to past averages, Tech is over one-third of the overall market value and expected to outgrow its equal-weighted 503-constituent index brethren by 2:1 – for both the top and bottom lines.
And that brings us ‘round to Goldilocks. Nominal and real economic growth below historic averages are positive in that they are perceived to be high enough to avoid a recession, while affording the FOMC to cut Fed Funds a bit more into the low 3% range – before causing the overall economy to stall out if employment weakens while the Fed remains too hawkish. On that point the Fed has a bad reputation: they are well known for keeping rates too high for too long, as well as too low for too long. So hopefully no one will do anything stupid (for the more refined: “unwise”), which upsets the apple cart of confidence. Not too hot and not too cold is amenable to the Fed and investors, so long as the leaders of our Representative Republic also don’t do anything unwise. One of the saving graces of government is that ever-growing bureaucracy necessarily leads to incompetence, which is fine so long as it allows corporate America to go about its business of innovation, growth, and jobs.
At present, sales and earnings growth estimates reflect the continuation of such, and thus we enter the realm of disbelief. It’s difficult for us to believe that many folks don’t believe the economy or corporations are in a growth phase. Perhaps it’s a result of poor media filters or the living “outside in” as a function of social media and community echo chambers (choosing your truth), but we’re continually surprised when folks see the data we pass on and are “shocked” to see that we’re not on the precipice of the Zombie Apocalypse. It may be our own faulty perception that this phenomenon has gotten worse over the past ten years or so (with both D’s and R’s in the White House), but negativity in the face of quite positive overall conditions is boggling the mind. Look no further than the most logical relationship between higher corporate profits and higher values of those companies’ shares. With the rare exception of 1997-2000 (the “dot-com” valuation/funding debacle), the value of the S&P 500 index has moved parallel with the profits of its constituents, albeit with a lag inherent in any system with a disconnect of intra-day valuation vs. quarterly fundamentals.
So what about consolidation? Well, since the low point last year, the S&P 500 and Nasdaq 100 indexes have risen 42% and 53%. We’ve only seen a 5% consolidation over the past 8 months. And of course, many companies leading the indexes have gained much more. Since August, leadership within the SPX has become populated with second-tier names (though with their own merits), such as Western Digital (WDC), Micron (MU), Seagate (STX), Robinhood (HOOD), and Warner Brothers Discovery (WBD). These five rose between 170% and 280% last year. WDC, MU and STX are beneficiaries of AI-related memory demand, are and have historically been extremely volatile stocks given where they lie in the tech stack foodchain. HOOD is growing earnings around 25% and trading at 56x trailing and 45x forward EPS. WBD has been in the acquisition-target seat, has had one small profitable year out of the last four, does not pay dividends, is expected to see a -30% drop in cash flow this year, and is trading at 78x trailing earnings (2025 was that one profitable blip). It gained 173% last year. To sum up, equity prices have indeed reflected their underlying fundamental growth, but index leadership has changed for the worse and more volatile, and we would not be surprised to see a healthy, “cooling off period” sometime during the year. December’s close was about the same as November’s, so perhaps it is already afoot.
Significant index changes would also not be a surprise either this year or next (hopefully). Hand-in-hand with index leadership goes index constituents. One might recall that META and NFLX (among others) were added to the Russell 1000 Value index in the middle of 2022. Those changes were precipitated by the significant correction to Growth/Tech stocks, having skyrocketed from 2020 COVID lows. While neither of these two companies are within the top 10 holdings of the R1000 Value index today, that list does include GOOG, AMZN and MU. META remains in the top 20.
A similar, though worse, condition exists within the S&P 500 Value index. Within its top 11 holdings by market value are Apple (1), Microsoft (2), Amazon (3), AMD (9), and Micron (11). Since Q1 of last year, Info Tech has risen from 16% to 20%. That’s a 25% increase for the sector overall, but for these 5 companies, the average increase in index weight has risen by 63%. AMD’s weight rose 86% in nine months, while Micron’s rose by 193%.
In case you haven’t guessed it, this could be a problem for overall market volatility (risk) metrics if sustained, as well as benchmark integrity and benchmarking. Few would place an 18% EPS grower with a 36x multiple in the Value bucket (MSFT). Nor a 50% grower with a 55x multiple (AMD). Nor a 29% grower with a 32x multiple (AMZN). Nor a….you get the drift. In this way it feels very much like 2022’s extension of the Value title to META and Netflix.
If one looks at core US equity manager performance after about August of last year, one will see a significant lag in all three style styles relative to benchmarks. That is because the philosophy and stewardship didn’t change (no style drifting), yet the styles themselves did. One of two things have to happen going forward: either index sponsors become much more selective and proactive about constituent management, or fund/model managers will add Growth stocks to their own Value holdings in order to stay afloat against their “benchmark”. It’s gonna be Style-Drift City if the folks at Russell and Standard & Poors don’t watch their P’s and Q’s.
Finally, a word or two on the “Outlook”, in addition to what was included above and is contained within our monthly attachments. As in years past, listed below are the current “Capital Market Assumptions” (CMAs) for major asset classes, as developed by BlackRock, the largest asset manager on Mother Gaya. Here’s what they lay out by way of introduction:
“Our capital market assumptions (CMAs) account for today’s wide range of potential outcomes driven by an accelerating economic transformation (BlackRock’s emphasis). We use scenarios to capture this wider range of outcomes, with mega forces – big structural shifts like digital disruption and artificial intelligence (AI) – becoming the new anchor for returns.”
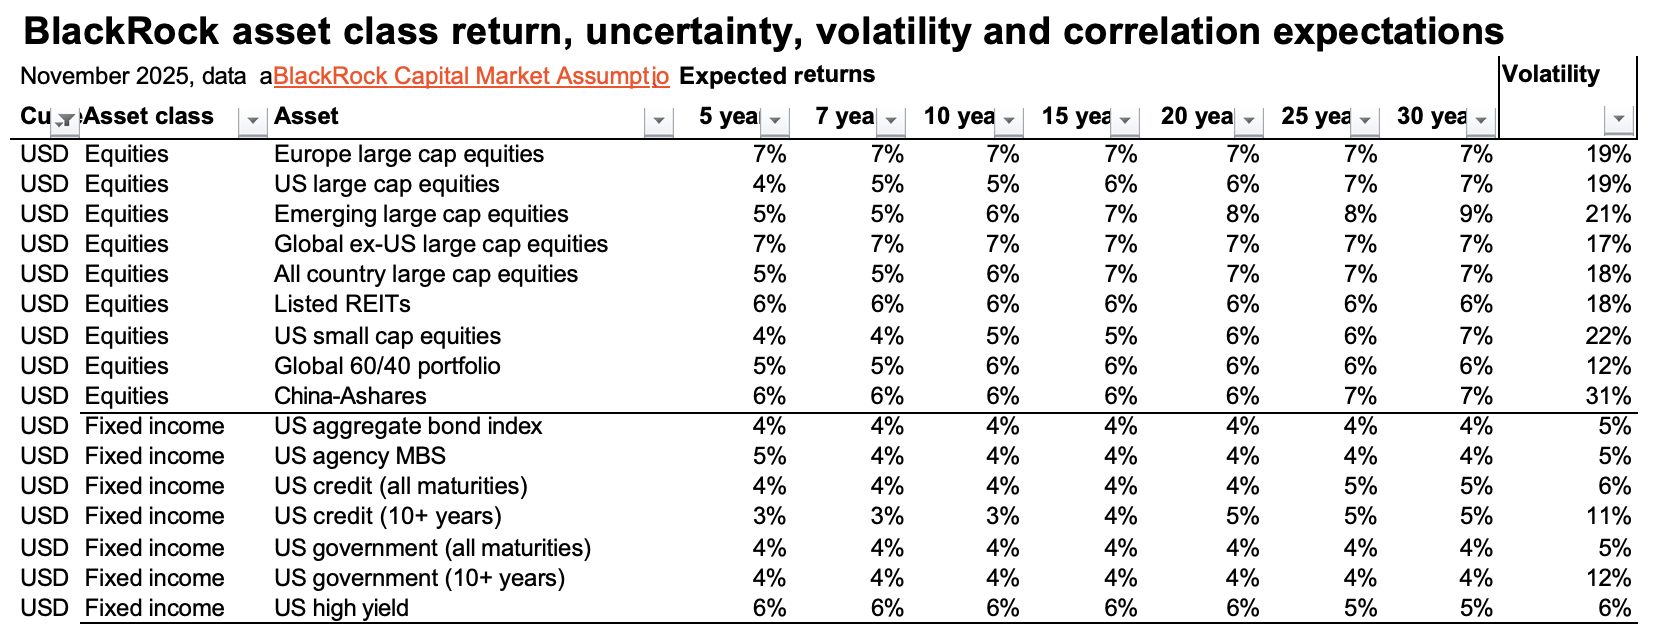
So in other words, equities 5-7%, bonds 3-4%. Thank you very much BlackRock. And lest anyone take this baseline forecast too seriously, at the beginning of 2024 their estimated 10-year returns for Europe large cap and US large cap were 8.9% vs. 4.9%. A year later they’re 7% vs. 5%. But including an AI-investment boost (driven by the US of A, not shown above, their estimate for both over the next 10 years is 7% (Europe) vs. 14% (US). If you’d like to peruse their estimates and download the data for yourself, go to: www.blackrock.com/institutions/en-global/institutional-insights/thought-leadership/capital-market-assumptions.
So good news if baseline, and great news if the AI assist materializes. Bonds will be bonds. Now for either the pep talk or the intervention. Anyone want to guess at how accurate forward-looking CMAs have been over time, and especially of late? Spoiler alert: not too accurate.
Here’s an excerpt chart and commentary from a 2024 analysis comparing 2013 CMAs with actual results:
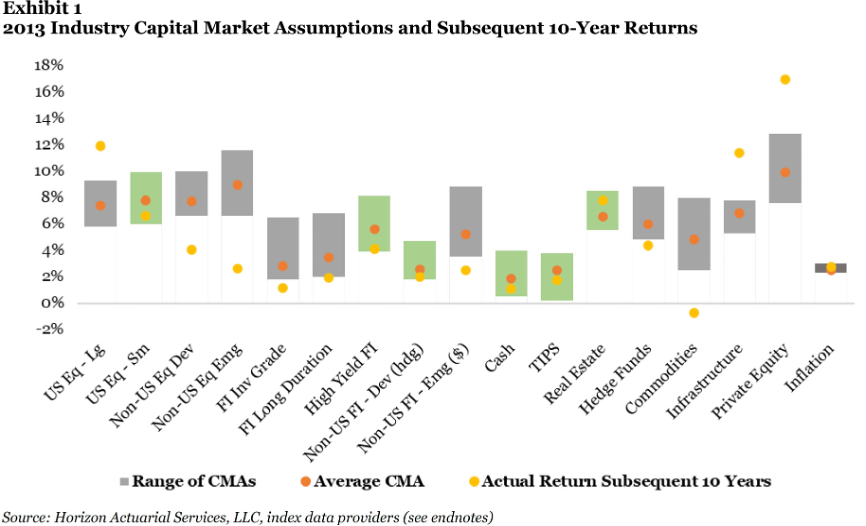


Source: “The Accuracy and Use of Capital Market Assumptions”, Mike Sebastian, 2023
Conclusions should be fairly obvious. We don’t place much value on the year-to-year prognostications of the “experts”, even if they all went to Ivy League schools and have impressive acronyms after their name. Instead, we have faith in the economic and market system, such as it is, that over time companies with rising profits will outperform companies with lower profits, and the broader market as a whole. Estimated earnings growth for the next 3-4 years is higher than at any time in the past several decades, and that should be reflected in stock price values over time. But those again are just estimates that will change. Healthy consolidations can and should occur, just like a downpour following unusually long periods without rain. And the sun will rise again tomorrow.
We leave you with two quotes, and wish you a happy and grounded 2026:
“The function of economic forecasting is to make astrology look respectable.”
John Kenneth Galbraith, notable economist and author
“Individuals who cannot master their emotions are ill-suited to profit from the investment process.”
Benjamin Graham, ‘Father’ of Value Investing and mentor of Warren Buffet, et al.