

by Justin J. Long CFP® on Aug 4, 2026, 7:25:55 AM
Where We Were
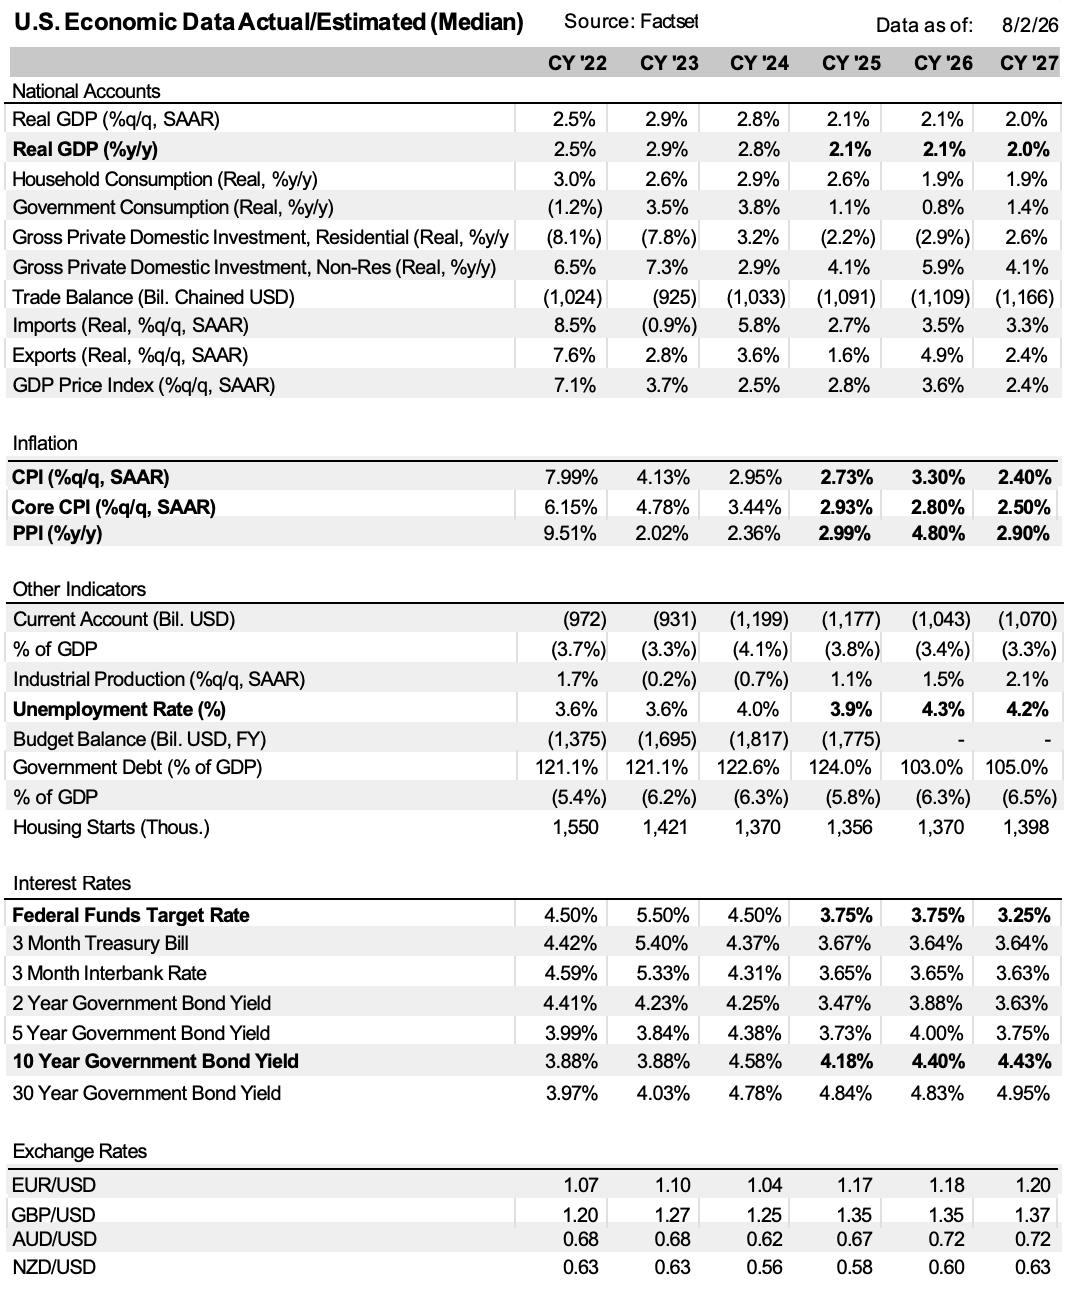
2025 was another great year for equities, as well as fixed income – despite a cloud of despair present in so many minds around the country. President Trump rode a strong wave of economic hope and goodwill early in the year, mostly focused on dismantling selective government overreach and lowering taxes. That goodwill was quickly dashed against the rocks of see-saw tariff and trade policy changes, retaliation by quite important (and powerful) trade partners, as well as an unwise attack on the Federal Reserve and the members of the FOMC. As a result, confidence as well as economic and earnings growth projections tapered off between the end of Q1 and into Q2. That both coincided with, and likely caused, an overdue equity market correction between March and April.
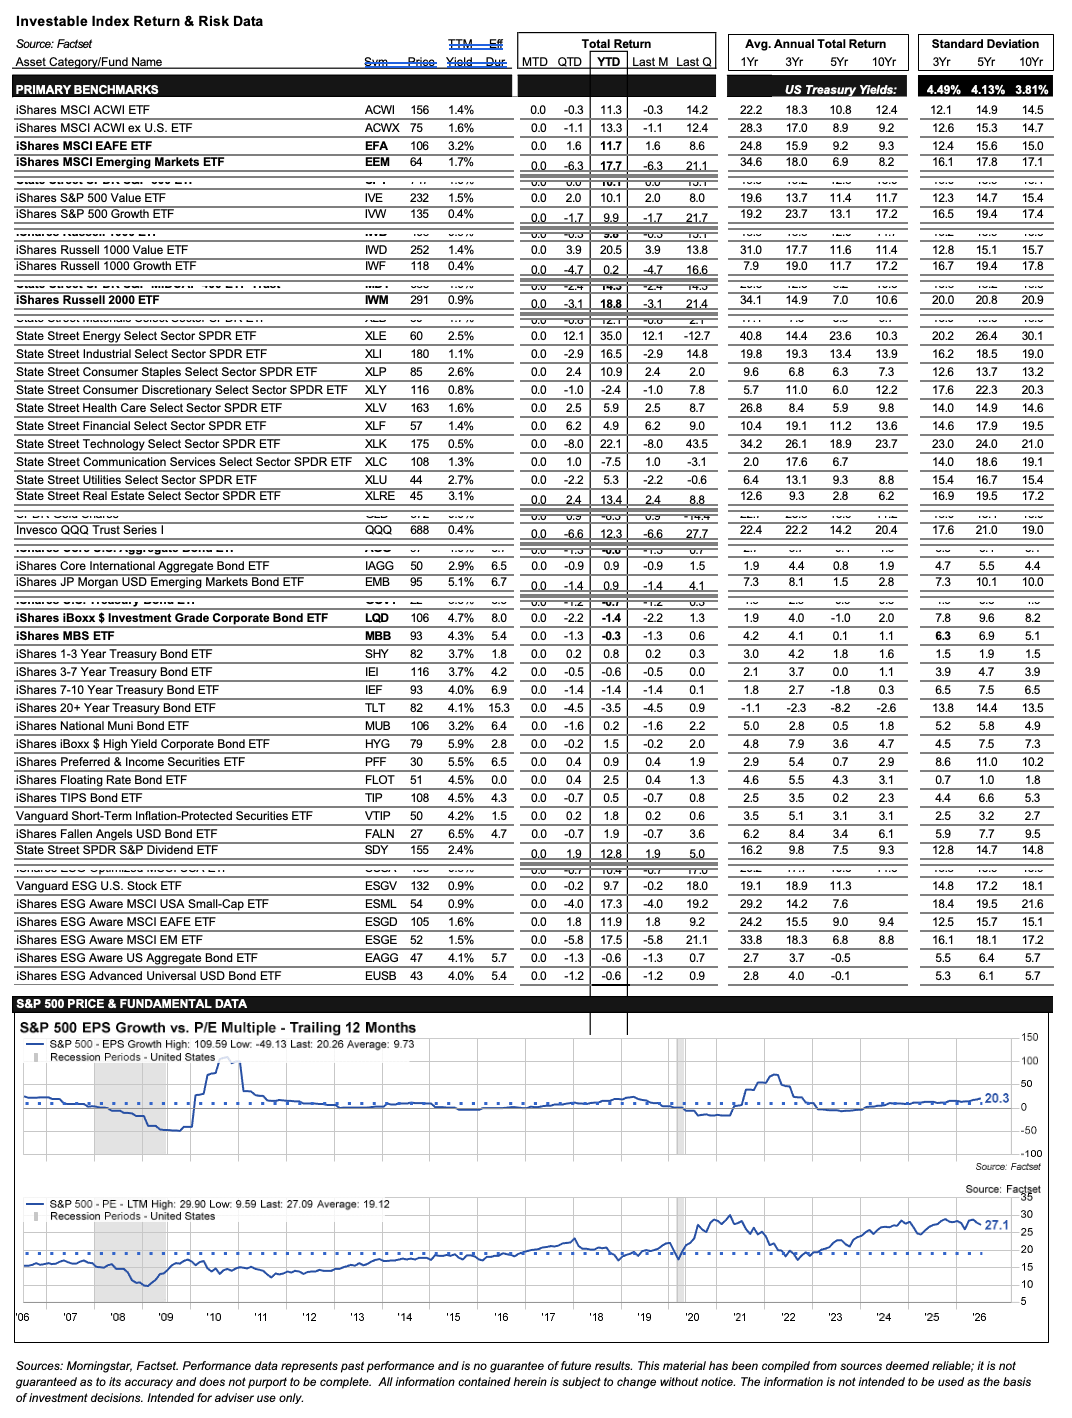
Market conditions and confidence rose again after Q2 earnings results started to come in, as they did not reflect the doom-and-gloom forecasts of many an economist and talking head. Corporate earnings rode a tailwind of stronger-than-expected incomes, spending and net worth, as well as expanding margins and cash flow led by growth companies. Strong earnings results and forecasts continued throughout the rest of the year. Equity returns were strong across the board and led by foreign emerging markets (+34%), foreign developed markets (+31%), and US large cap growth (again, +22%). The S&P 500 rose +18%. Fixed income returns were extremely even across the board and generally well above their long-term averages, buoyed by tapering inflation and overall US economic growth projections (after inflation) of a bit less than 2%. The Aggregate Bond index rose 7%, while 7-10 year Treasurys, investment-grade corporates, mortgage-backed, and high yield bonds all returned 8+% on the year, proving once again that the Chicken Littles (“60/40 is dead”) should remain unheeded.
Where We Are
Source: Factset
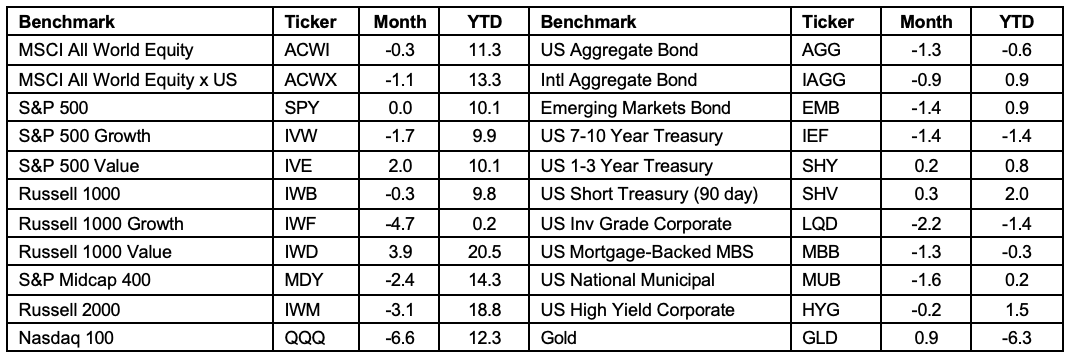
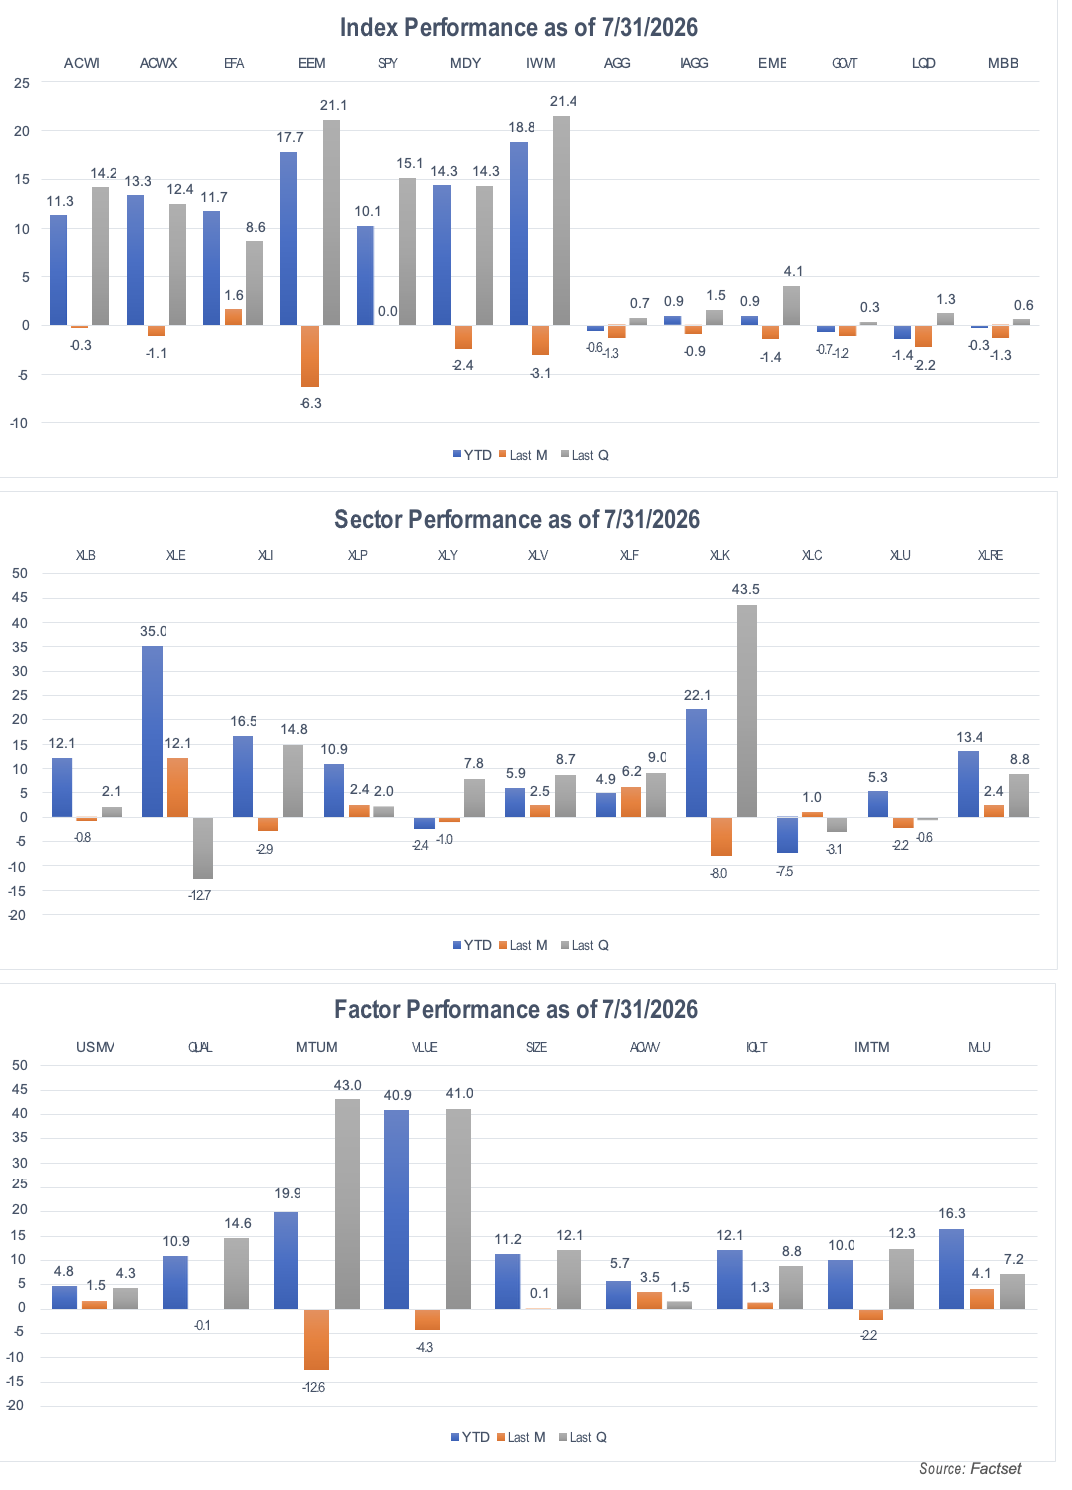
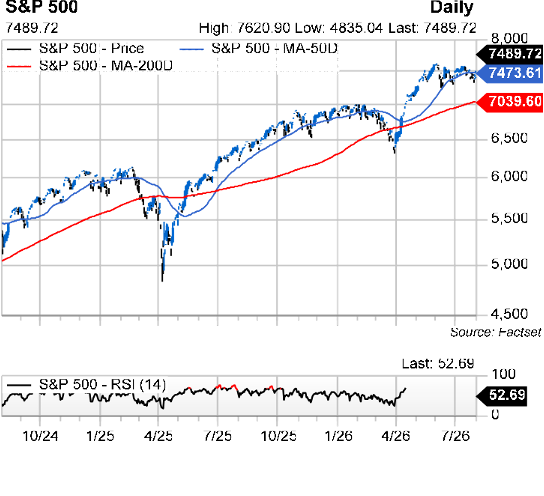 All-time high territory, but off for the month. The S&P 500 index was flat for July, still up 10% YTD. Global stock indexes were also flattish last month, except for the Growth subcategories. Mid and Small Cap were also off. Within the S&P 500, Growth was off -2% for the month, while Value was up 2%.
The US Aggregate Bond index is off -0.6% YTD. The 10-year T-Note yield is at 4.71%.
Q2 Results. With 61% of S&P 500 constituents reporting, 77% beat revenue estimates, with the average upside surprise being 3%. 86% beat EPS estimates, with the average beat coming in at 31%. Actual Q1 EPS growth is 47% vs. the 19% expected at the beginning of Q2.
S&P 500 earnings expectations. For 2025, final EPS was $270/share, up 13% vs. 2024. The 2026 estimate is $354 (+31%), 2027 is $401 (+13%), and 2028 is $459 (+15%). P/E ratios for ’26-28 are 21x, 19x and 16x. The P/E-to-Growth (PEG) ratios are 0.7, 1.5 and 1.1. The average EPS growth rate over the past 20 years is 7.5%; the average trailing and forward P/E ratios are 20x and 17x, while the 20-year average trailing PEG ratio is 2.6x. The consensus median price target for the SPX is 9095 vs. 8940 a month ago and 8721 sixty days ago, for an implied price return of +21%. If achieved this calendar year, the implied total return for the S&P 500 in 2026 would be 31%.
Where We're Headed
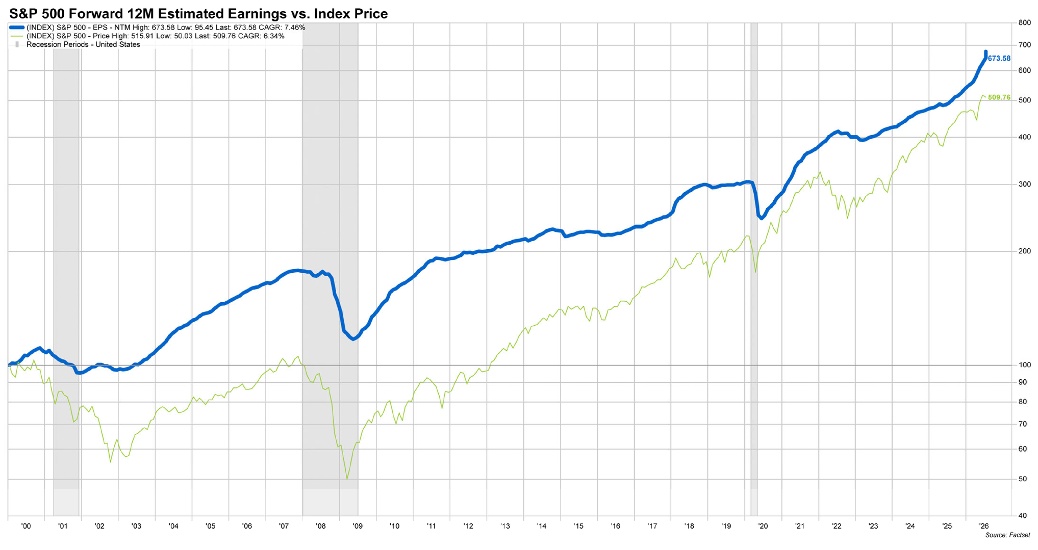
S&P 500 EPS Growth Estimates Still Increasing. The current consensus EPS estimate is $354 for 2026. That EPS estimate was $298 a year ago and $308 at the beginning of the year. The initial (January) EPS growth rate estimate for 2026 was 14%; today it is 31%. The bulk of that increase has come from the Info Tech sector, whose weight in the S&P 500 is roughly 40% and whose 2026 estimated EPS growth is 52%. And as we’ve written previously, S&P 500 index quarterly earnings results were 2x expected growth in Q4 2025 and Q1 2026. So far for Q2 with 61% reporting, actual EPS growth is 47% vs. the 19% expected at the beginning of the Q.
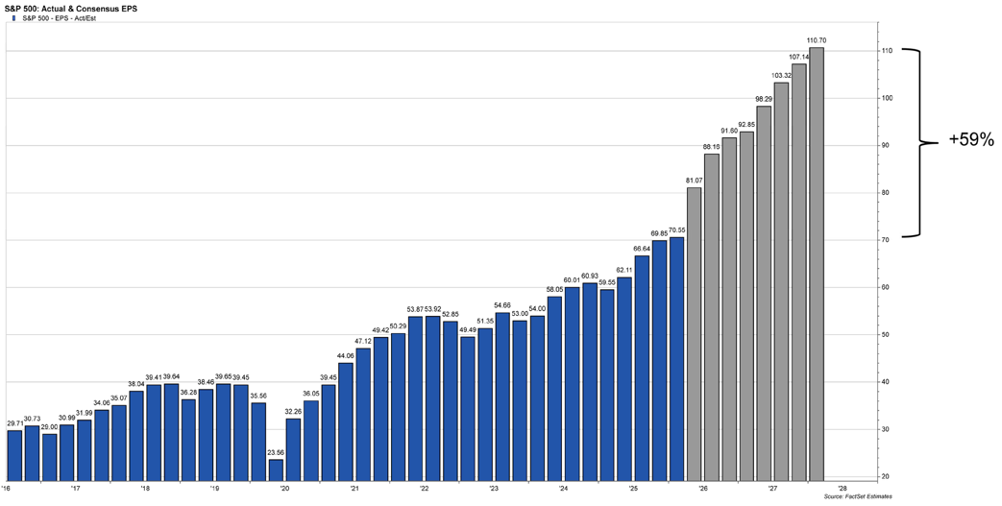
It is a similar story for quarterly EPS estimates, which now reflect close to 60% growth between Q1 of this year and Q1 of 2028. And here’s a trivia question: when in market history have there been three consecutive years (or more) of 15%+ EPS growth for the S&P 500? Answer: 1992-1994, and 2002-2004. And when have they occurred within a non-economic/market recovery year? Never.
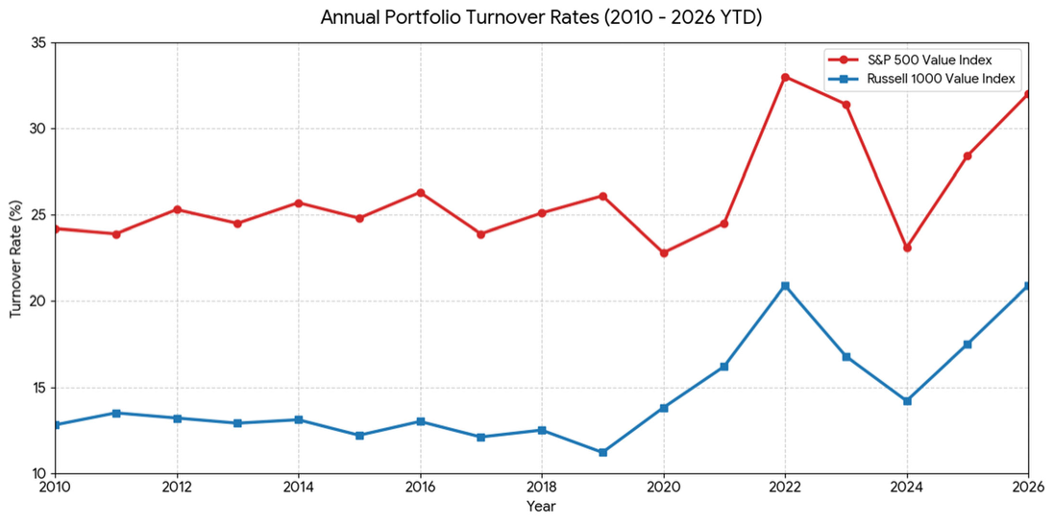
Houston….we have a problem, a.k.a. Value Index rebalancing. Before June of this year, Amazon, Apple, Microsoft and others in the Top 10 holdings were classic Growth names. These three were added to the Russell 1000 Value index during the June rebalancing, alongside Intel, which is trading at 88x trailing EPS and 60x the 2026 estimate. Total Info Tech sector influence of the R1000 Value in index has risen from an average of 9-10% over the previous 6 years to 19% - almost double. A similar problem has risen within the S&P 500 Value index, which also has 19% Info Tech. And remember that the 2023 Info Tech spike threw off many comps for the S&P 500 Value index, given that its top performers included “Growth-in-Value’s-Clothing”: Meta, Salesforce, Palo Alto Networks, Amazon and Intel.
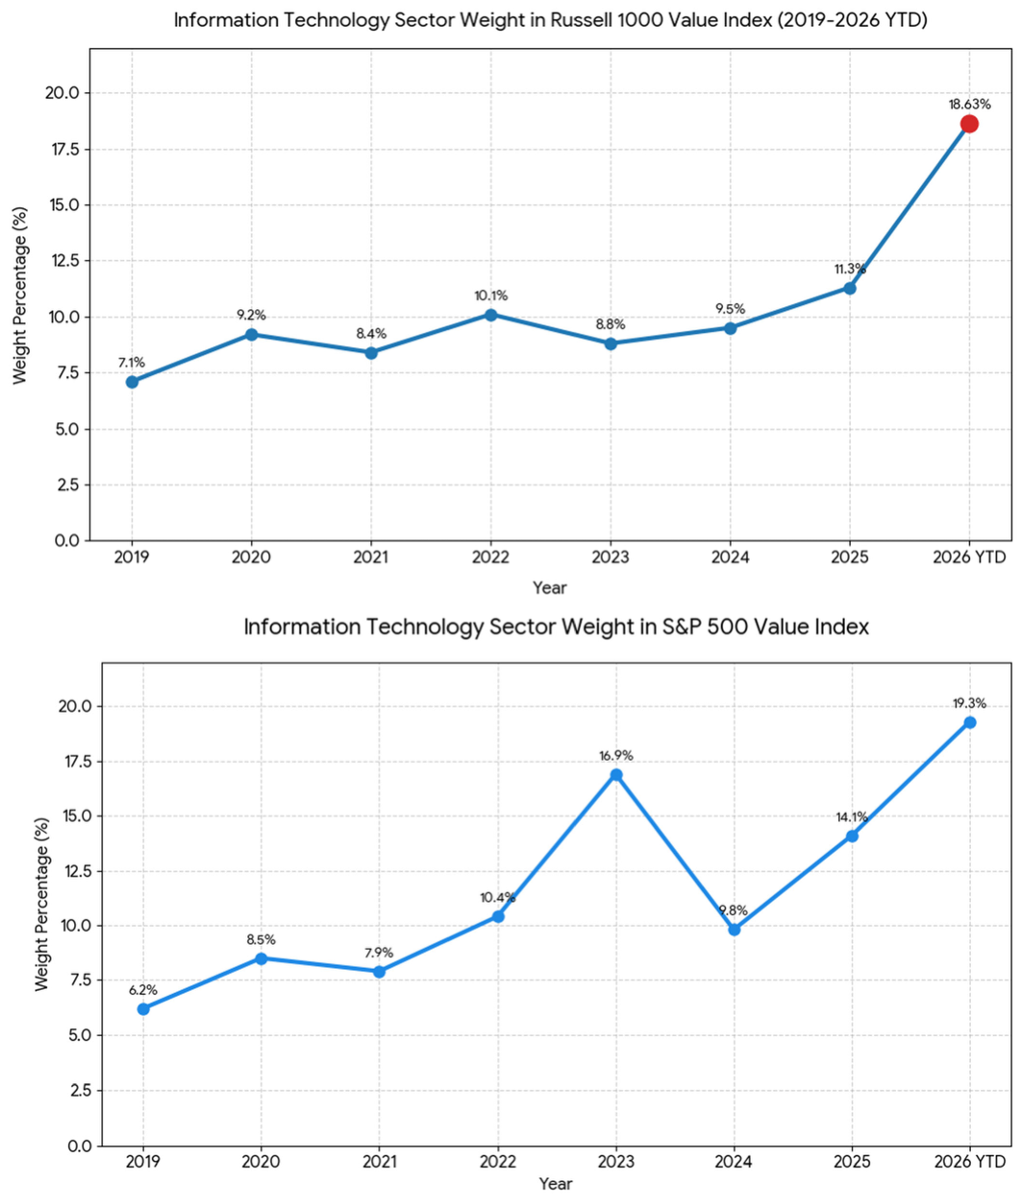 Sources (both charts): Factset, Gemini, Cook Bieler
In general, it is wise to be apprised of index composition for benchmarking purposes, but we have another specific reason for discussing the new reality of Value indexes. From August forward, unless and until Value indexes start looking and behaving like Value indexes again, we are benchmarking Dividend Achievers against the S&P 500 Dividend Aristocrats Index. Like our beloved Dividend Achievers, the Dividend Aristocrats require many years of consecutive dividend increases (25 vs. our average of 28 but 10 minimum), and have a similar dividend yields (2.5% vs. our 2.7%). By contrast, the current yields on the R1000 Value and SP500 Value indexes are 1.4% and 1.7% respectively. Perhaps most importantly, Value index constituent turnover has increased dramatically in the past few years, whereas the turnover of high-quality dividend payers with long track records of consistent increases has not. The bottom line is that you’ll see both the Dividend Aristocrats and R1000 Value indexes included in the Dashboard for one more month, then we will convert to the Aristocrat index exclusively.
Sources: Factset, Gemini, Cook Bieler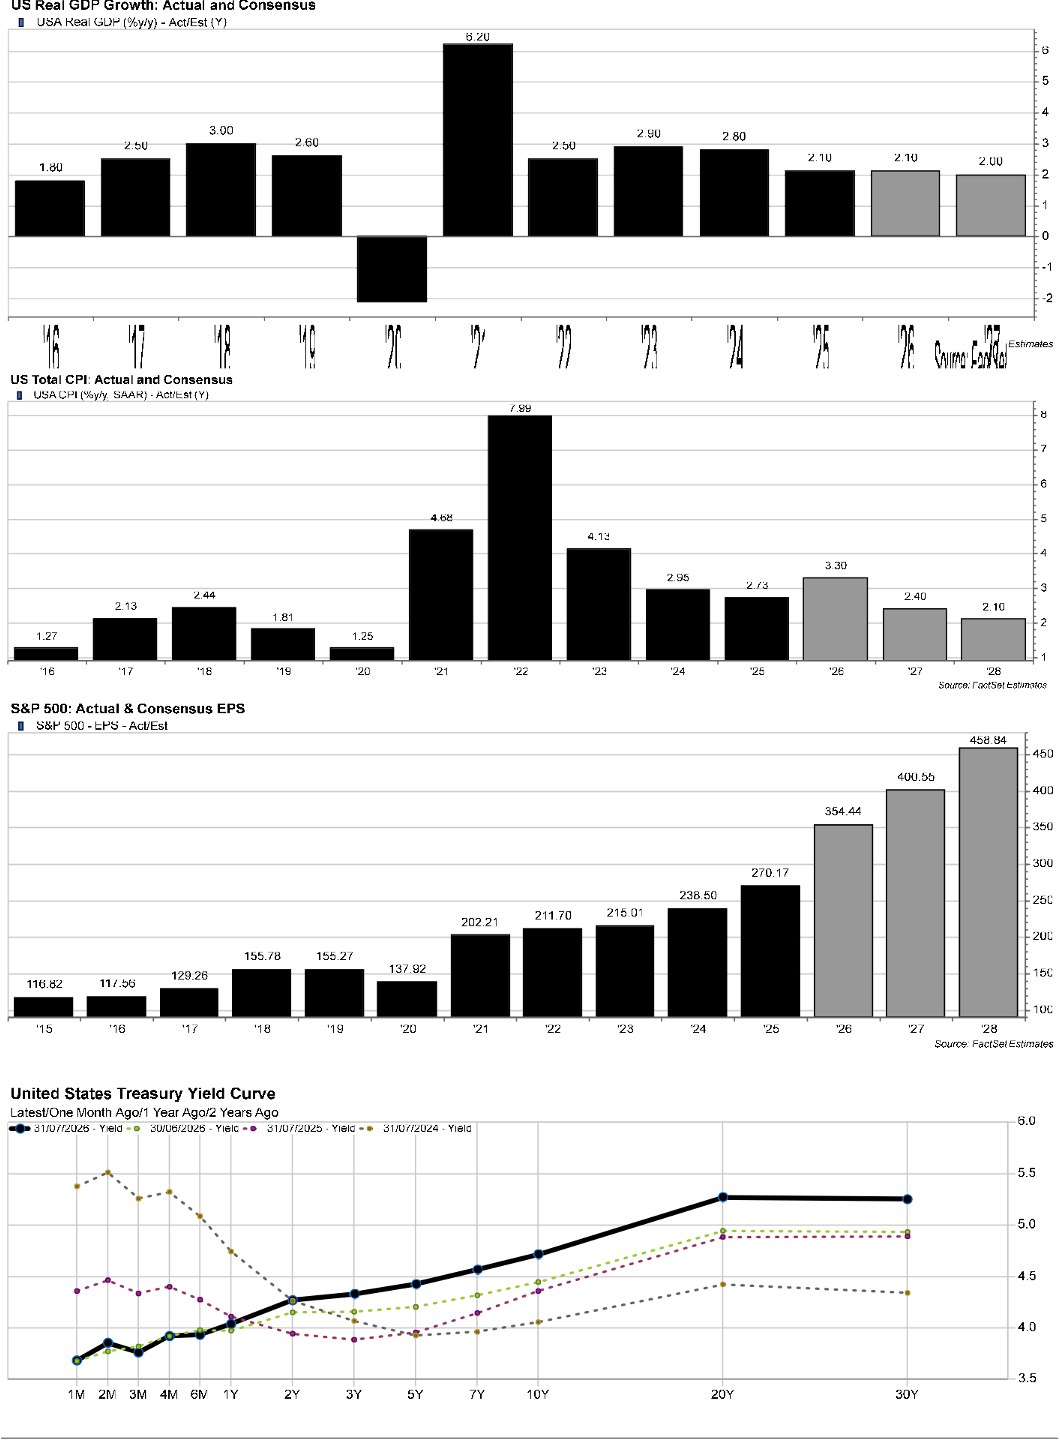 Source: Factset